Tutorials
Single cell ATAC-seq
To get started, we recommend epiScanpy’s analysis pipeline for scATAC-seq data for 10k PBMCs from 10x Genomics. This tutorial focuses on preprocessing, clustering, identification of cell types via known marker genes and trajectory inference. The tutorial can be found here.
NB: The current tutorial is a beta version that do not include either optimal low embedding & clustering settings or proper cell type identifications. To check out performance see other tutorials below and an updated version will be available very soon.
If you want to see how to build count matrices from ATAC-seq bam files for different set of annotations (like enhancers). The tutorial can be found here.
Soon available, there will be a tutorial on preprocessing, clustering and identification of cell types for the Cusanovich mouse scATAC-seq atlas [Cusanovich18] (prefrontal cortex data). In this tutorial we focus on the use of different feature space count matrices (peak and enhancer based count matrices).
An additional tutorial on processing and clustering count matrices from the Cusanovich atlas. Here.
Single cell DNA methylation
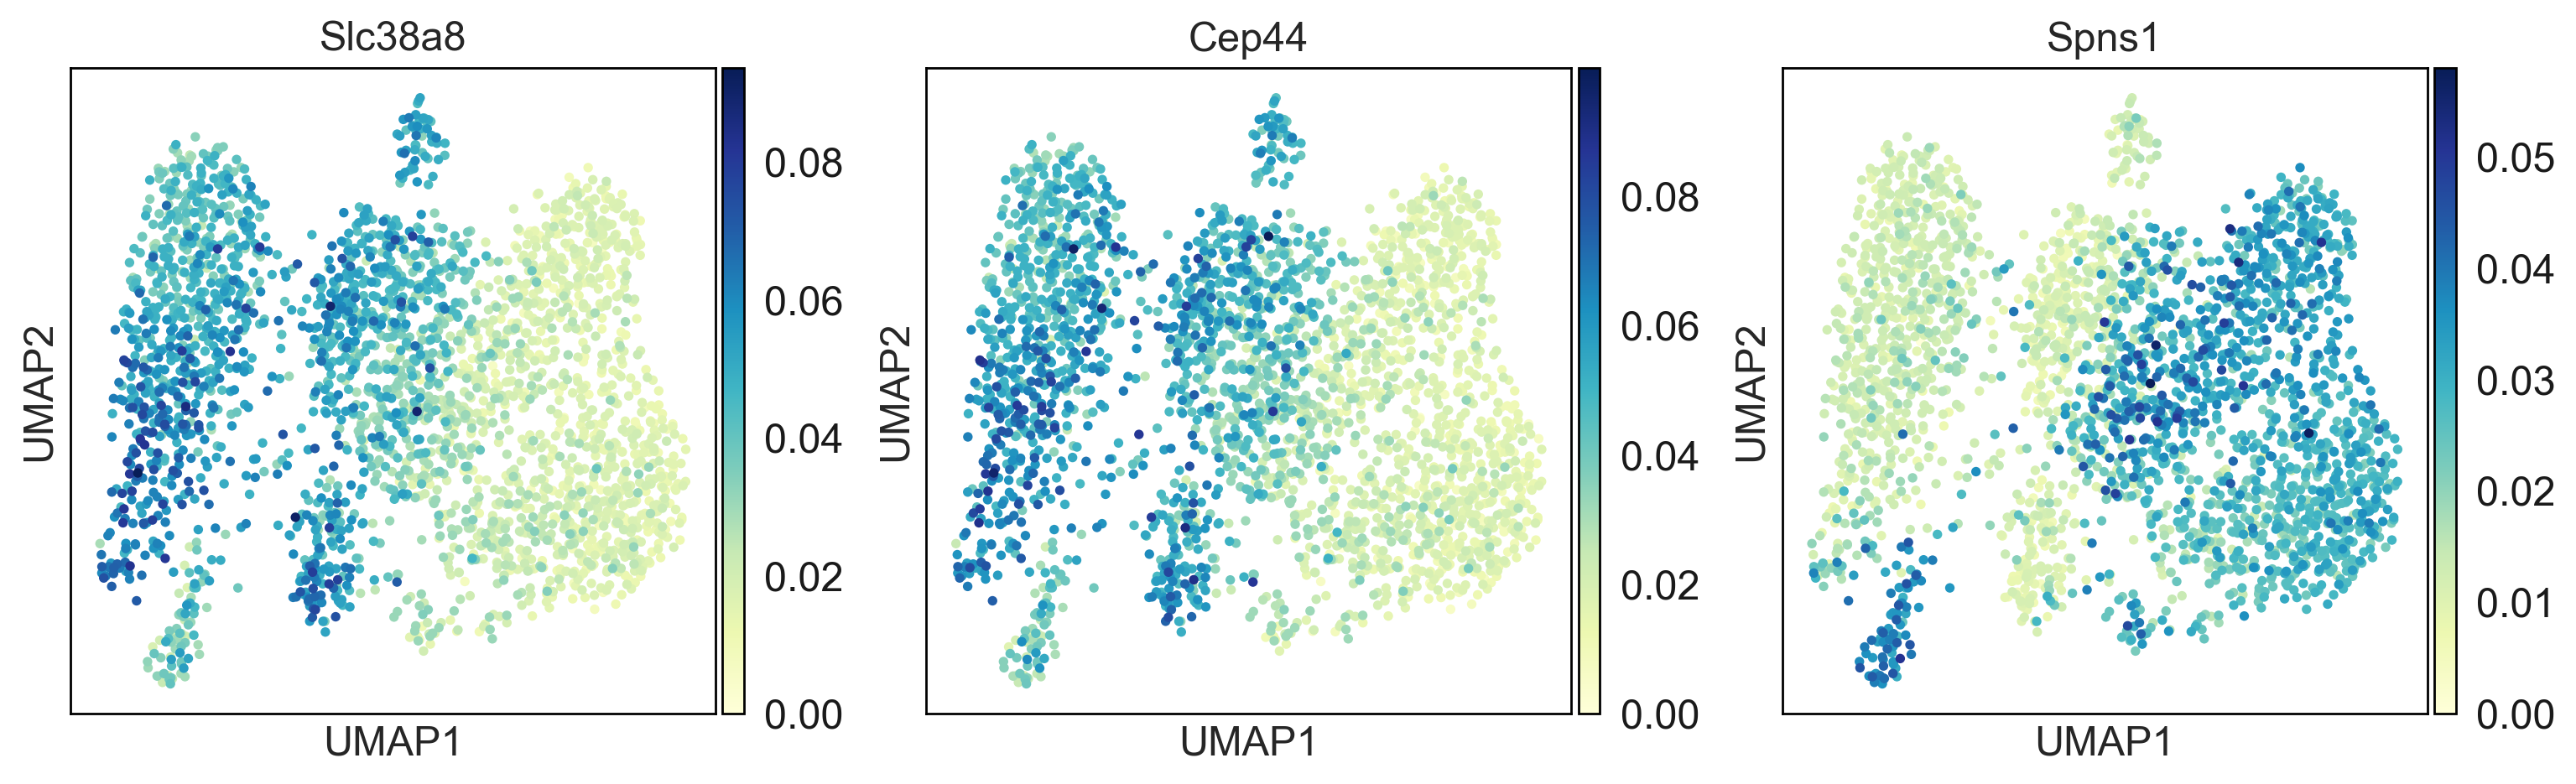
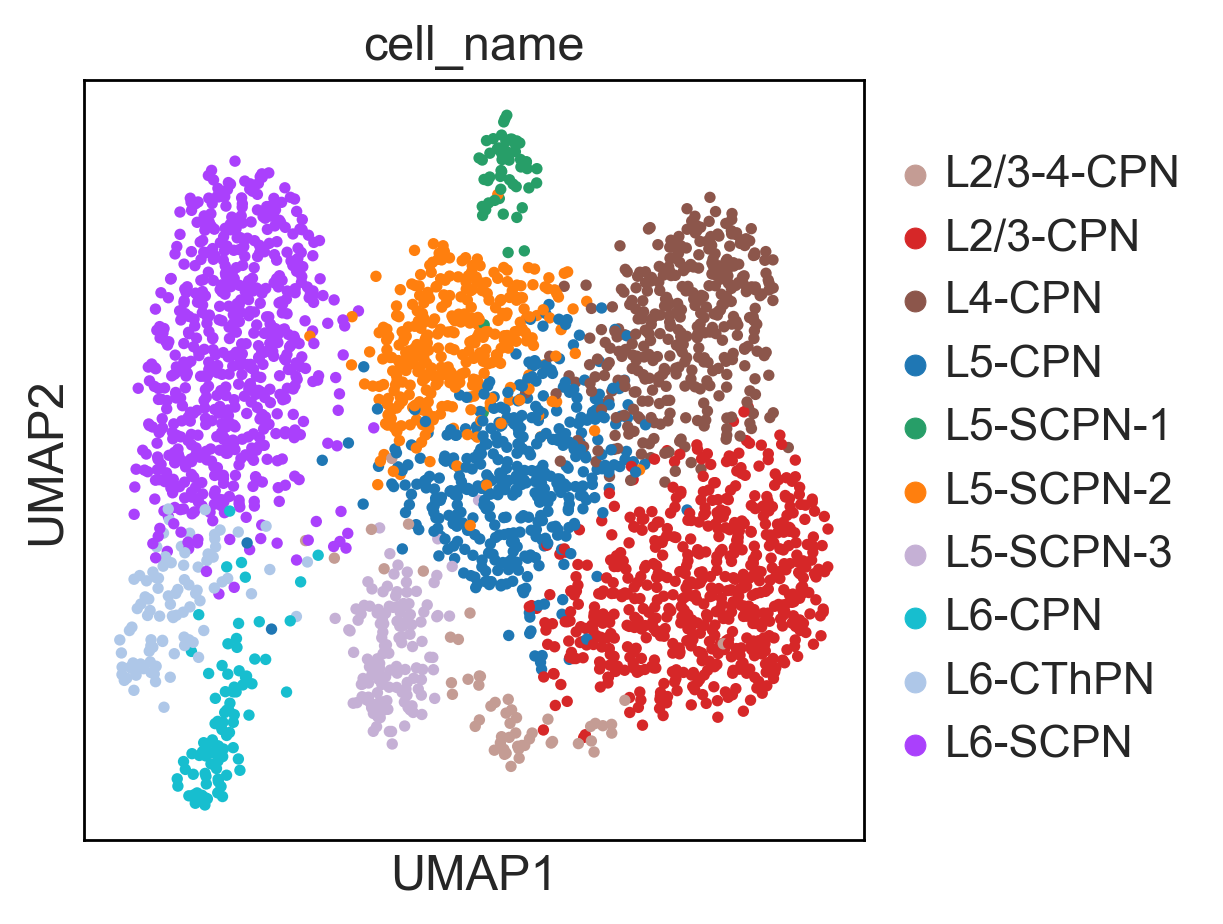
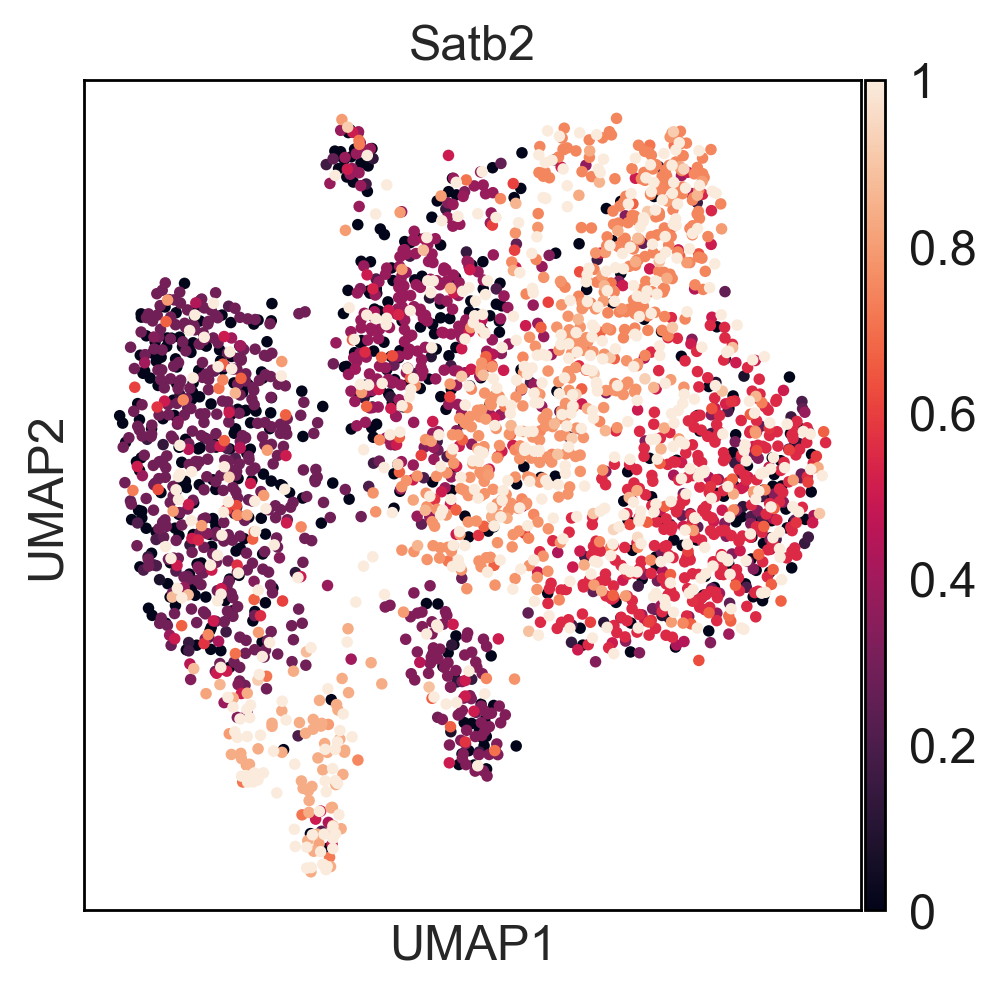
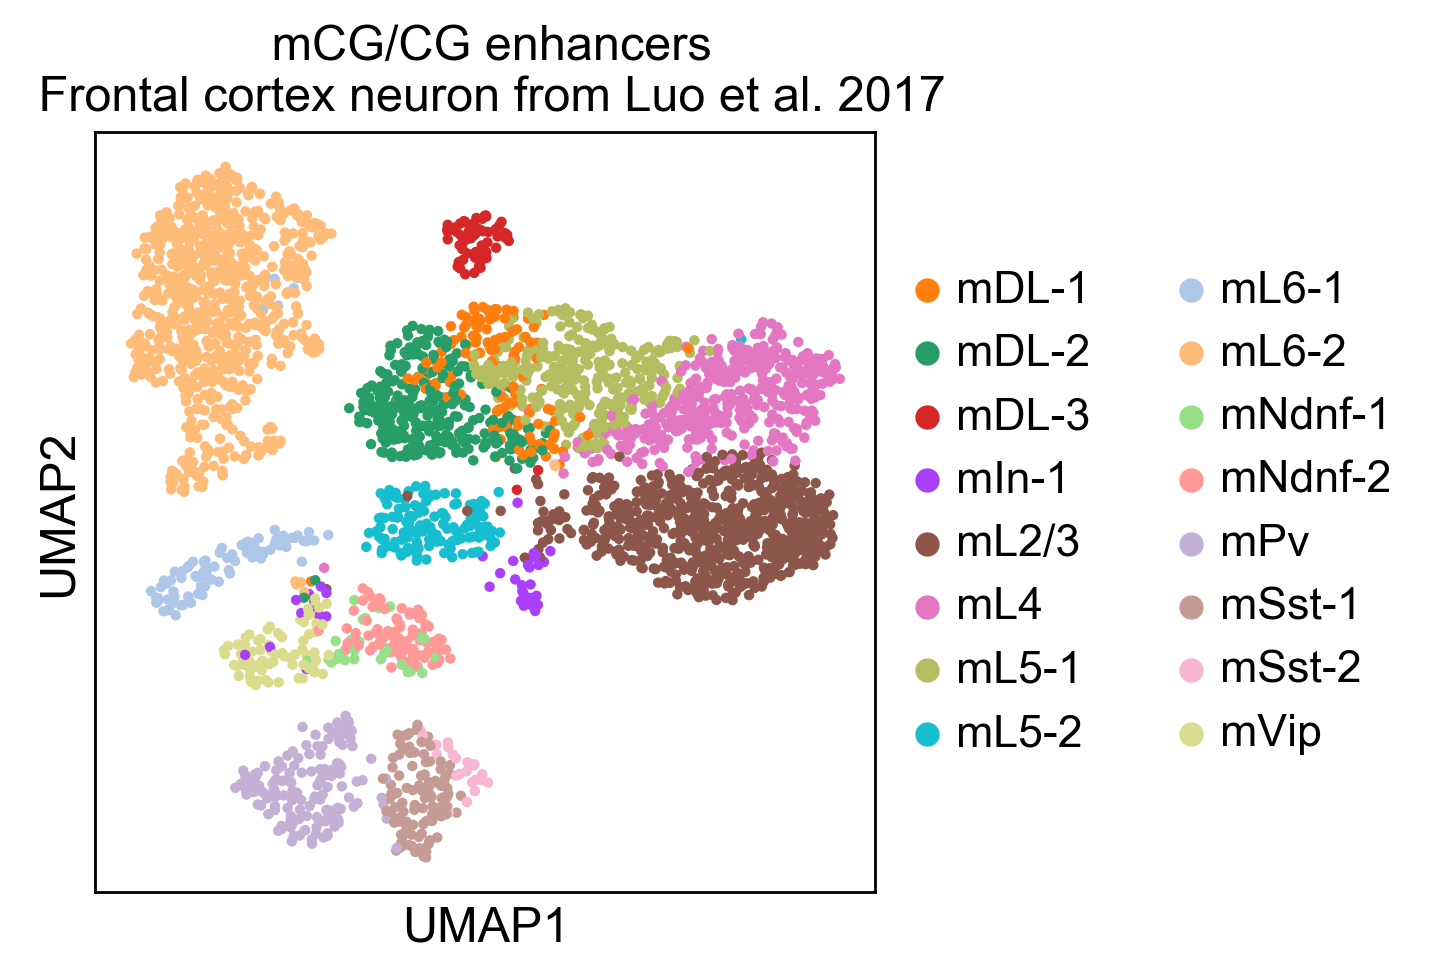
Here you can find a tutorial for the preprocessing, clustering and identification of cell types for single-cell DNA methylation data using the publicly available data from Luo et al. [Luo17].
The first tutorial shows how to build the count matrices for the different feature spaces (windows, promoters) in different cytosine contexts. Here is the tutorial.
Then, there is a second tutorial on how to use them and compare the results. The data used comes from mouse brain (frontal cortex). It will be available very soon.